Jobs & Businesses
Photo courtesy of Emvolon located in Woburn, MA
Total Clean Energy Jobs
Total clean energy jobs in Massachusetts have increased to 115,291, after a brief decline due to the COVID-19 pandemic, and doubled in size since 2010.1-2 Between 2010 and 2023, the Commonwealth’s clean energy industry added a net 57,610 jobs, which accounts for 12% of all net jobs created in the state during that same time.
MA clean energy industry ranks nationally:

#2
For total jobs relative to number of overall jobs in the state
#3
Total jobs per capita
#6
For total jobs
Although the COVID-19 pandemic had an impact on the Massachusetts labor market, clean energy jobs have fully recovered from pandemic-related losses. Between the 2023 and 2024 reports, clean energy businesses added 5,226 jobs, which is a 5% increase compared to 1% growth of the overall state economy during the same time frame.3-4
Total Clean Energy Jobs
REPORT YEARS 2010-2024
Total clean energy jobs in Massachusetts have increased 13% following COVID-19-induced job losses in 2021, while total employment in the state has grown only 0.02%.5
100%
Job Growth Since 2010
Clean Energy Industry Jobs By Value Chain Segment
All parts of the clean energy industry value chain continued to grow, adding jobs between the 2023 and 2024 reports. Businesses with a primary focus on Installation represent the largest portion of the industry and experienced the highest growth rate (7%), adding 2,239 workers.6-7
Although the Utilities, Nonprofits, and Other segment represents the smallest portion of the value chain, it also experienced a 7% increase in jobs (373 jobs). The second largest value chain segment, Sales & Distribution, grew by 4% (1,078 jobs).
Although the Utilities, Nonprofits, and Other segment represents the smallest portion of the value chain, it also experienced a 7% increase in jobs (373 jobs). The second largest value chain segment, Sales & Distribution, grew by 4% (1,078 jobs).
Over 28% of clean energy jobs are in the Installation segment of the value chain, which also experienced the highest rate of growth between the 2023-2024 Reports
Clean Energy Jobs by Sector
Clean Transportation saw the greatest growth rate at 22%, adding 1,719 jobs. This is attributed to the increasing number of Electric Vehicle jobs, which aligns with a national trend.8-9
The Renewable Energy sector grew by 3%, and the Energy Efficiency, Demand Management, and Clean Heating and Cooling sector grew by 4%.
While the Energy Efficiency, Demand Management, and Clean Heating and Cooling sector continues to have the largest number of jobs (68%), Clean Transportation now represents 8% of clean energy jobs, an increase from 4% in the 2023 report.
Photo courtesy of Multiscale Systems located in Worcester, MA
All clean energy sectors experienced job growth between the 2023-2024 Reports.
MassCEC Spotlight
Modernizing The Electric Grid
The electric grid must be upgraded and modernized, but questions remain about how to do it equitably and cost-effectively.

Energy Efficiency, Demand Management, and Clean Heating and Cooling Jobs
Within the Energy Efficiency, Demand Management, and Clean Heating and Cooling sector, Advanced and Recycled Building Materials saw the largest number of jobs (866) added, followed by Clean, High Efficiency, and ENERGY STAR Heating and Cooling (487 jobs) between the 2023 and 2024 reports.10-11
The highest rates of growth were seen in the Other Grid Modernization (22%) and Other Grid (16%) subsectors.
The highest rates of growth were seen in the Other Grid Modernization (22%) and Other Grid (16%) subsectors.
The Energy Efficiency, Demand Management, and Clean Heating and Cooling sector represents the largest portion of clean energy jobs, with all subsectors experiencing growth between the 2023 and 2024 Reports.
MassCEC Spotlight
Charting a Path to Home Decarbonization
MassCEC’s Decarbonization Pathways program has developed comprehensive home decarbonization assessments, providing homeowners with a plan, technical assistance, and financial incentives for implementation.

Courtesy of a homeowner in Plainfield, MA participating
in the pilot program
in the pilot program
Clean Transportation Jobs
The Massachusetts Electric Vehicle workforce continued to grow, adding 1,018 jobs for a growth rate of 23%. This is significantly higher than the rate of Electric Vehicle job growth in the U.S., which increased by only 13% over the same time.12-13
The Commonwealth ranks 1st in growth rate of Electric and 4th for total number of Electric Vehicle jobs created in the U.S. between the 2023 and 2024 reports.
The Commonwealth ranks 1st in growth rate of Electric and 4th for total number of Electric Vehicle jobs created in the U.S. between the 2023 and 2024 reports.
All Clean Transportation subsectors experienced job increases between the 2023 and 2024 Reports, with the largest increase seen in Electric Vehicle jobs.
MassCEC Spotlight
Electrifying Massachusetts School Buses
MassCEC’s Accelerating Clean Transportation (ACT) School Bus program assists public school districts and transportation providers in completing successful electric school bus deployments.

Electric school bus in Quincy, MA
Renewable Energy Generation Jobs
Wind energy employment grew by 4% between the 2023 and 2024 reports, adding 110 new jobs. This is lower than the nationwide growth in wind jobs of 5%, but higher than New York’s wind energy job growth of 3%.14-15
Massachusetts’ solar industry grew by 3% (520 jobs), which is lower than the nationwide growth in solar jobs of 5%.
Massachusetts’ solar industry grew by 3% (520 jobs), which is lower than the nationwide growth in solar jobs of 5%.

Photo courtesy of Sol Clarity in Somerville, MA
Jobs were added in all Renewable Energy subsectors, with Solar experiencing the largest total increase of 520 jobs between the 2023 and 2024 Reports
7,512
Clean Energy Businesses in 2024
Clean Energy Business
The overall number of clean energy businesses in Massachusetts increased by 139 (or 2%) relative to the year before, with the largest addition of Renewable Energy businesses, at 72.16 Similar to prior years, the majority (53%) of businesses focused on Energy Efficiency, Demand Management, and Clean Heating and Cooling.
For the last few report years, small businesses (1 to 10 employees) account for 58% of all clean energy firms, while mid-size businesses (11 to 49 employees) represent 27%.
For the last few report years, small businesses (1 to 10 employees) account for 58% of all clean energy firms, while mid-size businesses (11 to 49 employees) represent 27%.
The composition of clean energy businesses in Massachusetts remains relatively unchanged since 2015, with the majority of businesses focused on Energy Efficiency, Demand Management, and Clean Heating and Cooling.17
Unionization Among Clean Energy Workers
Unionization Among Clean Energy Workers
Unionization rates across the clean energy value chain vary.18 The Installation segment has the highest average rates of membership and coverage, at 14% and 15% respectively. This is likely driven by the number of workers in occupations that have higher rates of unionization, such as electricians, plumbers, HVAC technicians, and construction workers.
The average unionization rate of the clean energy industry within Massachusetts is 6%, less than half of the overall unionization rate of the state at 13%.
The average unionization rate of the clean energy industry within Massachusetts is 6%, less than half of the overall unionization rate of the state at 13%.
The Installation segment of the value chain has the highest rates of union membership and coverage.
Clean Energy Opportunity: Talent Wanted
As of December 2023, 84% of clean energy employers reported that it was “very difficult” or “somewhat difficult” to find qualified talent.19

Over 37% of clean energy employers found it very difficult to hire qualified workers when surveyed for the 2024 Report.
MassCEC Spotlight
Offshore Wind Workforce and Community of Practice
Since 2017, MassCEC has awarded over $18M to 30 different organizations and institutions to advance offshore wind workforce development, improve access to opportunities, and conduct workforce studies.
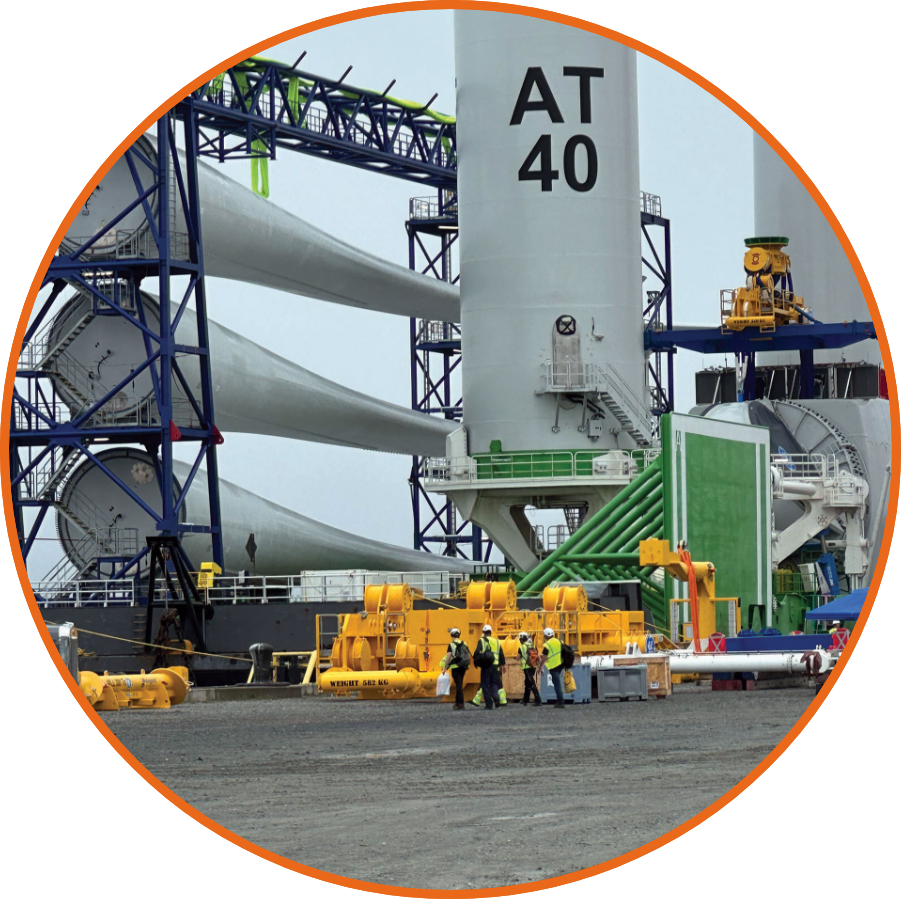
Staging of offshore wind turbine components at MassCEC’s New Bedford Marine Commerce Terminal.

MassCEC Spotlight
Regional Leadership In Offshore Wind
MassCEC, the U.S. Department of Energy, and the State of Maryland provided funding to a team led by University of Massachusetts Amherst and Johns Hopkins University to establish the Academic Center for Reliability and Resilience of Offshore Wind (ARROW).
MassCEC Spotlight
Empowering Massachusetts Communities’ Adoption of Clean Energy
Everyone needs and deserves to be part of our clean energy future, but underserved populations have less access to the benefits of clean energy and spend more of their paycheck on energy costs.

Clean Energy Worker Demographics
The representation of workers by demographic group as a percentage of the clean energy workforce remained roughly unchanged from the 2023 to 2024 reports.20 There was a 10% increase in female workers compared to a 3% increase in male workers in absolute numbers, however, the percentage of women working in the clean energy industry is still significantly lower than the overall Massachusetts workforce. The industry also saw a 9% increase in the number of workers over the age of 55.

Photo courtesy of Lithios in Medford, MA
The lower representation of women in the clean energy industry demonstrates the need to increase equitable workforce opportunities and resources (2024 Report)
2024 Clean Energy Employment
Percent of 2024 Clean Energy Workforce
Percent of 2024 Overall MA Workforce
Male
77,475
67.2%
51.0%
Female
37,815
32.8%
49.0%
Hispanic or Latino/a/x
17,870
15.5%
12.0%
Not Hispanic or Latino/a/x
97,421
84.5%
88.0%
White
86,122
74.7%
78.7%
Black or African American
9,339
8.1%
9.1%
Asian
9,569
8.3%
8.3%
American Indian or Alaska Native
1,153
1.0%
0.6%
Native Hawaiian or other Pacific Islanders
807
0.7%
0.2%
Two or more races
8,186
7.1%
2.1%
Veterans
9,684
8.4%
3.0%
Workers over the age of 55
17,985
15.6%
26.0%
2023 Clean Energy Employment
Male
77,475
Female
37,815
Hispanic or Latino/a/x
17,870
Not Hispanic or Latino/a/x
97,421
White
86,122
Black or African American
9,339
Asian
9,569
American Indian or Alaska Native
1,153
Native Hawaiian or other Pacific Islander
807
Two or more races
8,186
Veterans
9,684
Workers over the age of 55
17,985
Percent of 2023 Clean Energy Workforce
Male
67.2%
Male
32.8%
Hispanic or Latino/a/x
15.5%
Not Hispanic or Latino/a/x
84.5%
White
74.7%
Black or African American
8.1%
Asian
8.3%
American Indian or Alaska Native
1.0%
Native Hawaiian or other Pacific Islander
0.7%
Two or more races
7.1%
Veterans
8.4%
Workers over the age of 55
15.6%
Percent of 2023 Overall MA Workforce
Male
51.0%
Female
49.0%
Hispanic or Latino/a/x
12.0%
Not Hispanic or Latino/a/x
88.0%
White
78.7%
Black or African American
9.1%
Asian
8.3%
American Indian or Alaska Native
0.6%
Native Hawaiian or other Pacific Islander
0.2%
Two or more races
2.1%
Veterans
3.0%
Workers over the age of 55
26.0%
Clean Energy Wages
Massachusetts needs over 28,900 additional clean energy workers by the end of this decade to meet our decarbonization goals.21 It is important to increase awareness of careers within the industry, as many clean energy occupations currently earn hourly wages that are higher than the average hourly wage in Massachusetts.22

Several clean energy occupations earn higher wages than the Massachusetts average wage (2024 Report).
25th Percentile Hourly Wages
Median Hourly Wages
75th Percentile Hourly Wages
Average Hourly Wages
Massachusetts Average
$19.30
$29.18
$47.17
$38.62
Clean Energy Occupations:
Carpenters
$27.26
$31.86
$44.41
$36.01
Construction Managers
$52.85
$64.64
$80.87
$69.63
Electrical Engineers
$45.34
$60.32
$73.12
$61.50
Electricians
$27.92
$39.02
$47.44
$39.35
Heating, Air Conditioning, and Refrigeration Mechanics and Installers
$28.95
$35.43
$42.02
$36.15
Insulation Workers
$18.93
$25.45
$38.23
$29.08
Mechanical Engineers
$41.38
$52.16
$63.82
$55.55
25th Percentile Hourly Wages
Massachusetts Average
$19.30
Occupations:
Carpenters
$27.26
Construction Managers
$52.85
Electrical Engineers
$45.34
Electricians
$27.92
Heating, Air Conditioning, and Refrigeration Mechanics and Installers
$28.95
Insulation Workers
$18.93
Mechanical Engineers
$41.38
Median Hourly Wages
Massachusetts Average
$29.18
Occupations:
Carpenters
$31.86
Construction Managers
$64.64
Electrical Engineers
$60.32
Electricians
$39.02
Heating, Air Conditioning, and Refrigeration Mechanics and Installers
$35.43
Insulation Workers
$25.45
Mechanical Engineers
$52.16
75th Percentile Hourly Wages
Massachusetts Average
$47.17
Occupations:
Carpenters
$44.41
Construction Managers
$80.87
Electrical Engineers
$73.12
Electricians
$47.44
Heating, Air Conditioning, and Refrigeration Mechanics and Installers
$42.02
Insulation Workers
$38.23
Mechanical Engineers
$63.82
Average Hourly Wages
Massachusetts Average
$38.62
Occupations:
Carpenters
$36.01
Construction Managers
$69.63
Electrical Engineers
$61.50
Electricians
$39.35
Heating, Air Conditioning, and Refrigeration Mechanics and Installers
$36.15
Insulation Workers
$29.08
Mechanical Engineers
$55.55
Clean Energy Occupation Demographics
The disproportionately high representation of people of color among some of the more physically demanding roles masks inequality. For instance, Hispanic or Latino/a/x workers make up 40% of Insulation Workers in Massachusetts, but only 4% of Mechanical or Electrical Engineers. Women are underrepresented industry-wide, particularly in some of the high-growth occupations, such as electricians, just 3% of whom are women.23
Demographic representation in many of the highest-paying clean energy occupations is not equal (2024 Report).
Carpenters
Construction Managers
Electrical Engineers
Electricians
Heating, Air Conditioning, and Refrigeration Mechanics and Installers
Insulation Workers
Mechanical Engineers
Female
3.1%
10.1%
10.1%
2.9%
2.3%
5.4%
8.9%
Male
96.9%
89.9%
89.9%
97.1%
97.7%
94.6%
91.1%
Hispanic or Latino/a/x
28.3%
7.7%
4.1%
14.5%
14.2%
40.4%
4.1%
White
84.8%
87.8%
74.8%
85.5%
84.1%
70.3%
78.5%
Black or African American
4.3%
2.9%
2.5%
5.3%
7.7%
18.3%
2.1%
American Indian or Alaska Native
0.3%
0.1%
0.0%
0.4%
0.3%
1.0%
0.0%
Asian
1.5%
2.0%
21.0%
1.8%
0.8%
0.6%
15.3%
Native Hawaiian or other Pacific Islanders
0.1%
0.0%
0.0%
0.0%
0.0%
0.1%
0.0%
Two or more races
9.0%
7.1%
1.8%
7.0%
7.2%
19.8%
4.1%
Workers over the age of 55
19.2%
32.1%
32.6%
23.0%
22.0%
14.1%
23.4%
Carpenters
Female
3.1%
Male
96.9%
Hispanic or Latino/a/x
28.3%
White
84.8%
Black or African American
4.3%
American Indian or Alaska Native
0.3%
Asian
1.5%
Native Hawaiian or other Pacific Islander
0.1%
Two or more races
9.0%
Workers over the age of 55
9.12%
Construction Managers
Female
10.1%
Male
89.9%
Hispanic or Latino/a/x
4.1%
White
74.8%
Black or African American
2.5%
American Indian or Alaska Native
0.0%
Asian
21.0%
Native Hawaiian or other Pacific Islander
0.0%
Two or more races
1.8%
Workers over the age of 55
32.6%
Electrical Engineers
Female
2.9%
Male
97.1%
Hispanic or Latino/a/x
14.5%
White
85.5%
Black or African American
5.3%
American Indian or Alaska Native
0.4%
Asian
1.8%
Native Hawaiian or other Pacific Islander
0.0%
Two or more races
7.0%
Workers over the age of 55
23.0%
Electricians
Female
2.3%
Male
97.7%
Hispanic or Latino/a/x
14.2%
White
84.1%
Black or African American
7.7%
American Indian or Alaska Native
0.3%
Asian
0.8%
Native Hawaiian or other Pacific Islander
0.0%
Two or more races
7.2%
Workers over the age of 55
22.0%
Heating, Air Conditioning, and Refrigeration Mechanics and Installers
Female
5.4%
Male
94.6%
Hispanic or Latino/a/x
40.4%
White
70.3%
Black or African American
8.3%
American Indian or Alaska Native
1.0%
Asian
1.6%
Native Hawaiian or other Pacific Islander
0.1%
Two or more races
19.8%
Workers over the age of 55
14.1%
Insulation Workers
Female
5.4%
Male
94.6%
Hispanic or Latino/a/x
40.0%
White
70.3%
Black or African American
8.3%
American Indian or Alaska Native
1.0%
Asian
0.6%
Native Hawaiian or other Pacific Islander
0.1%
Two or more races
19.8%
Workers over the age of 55
14.1%
Mechanical Engineers
Female
8.9%
Male
91.1%
Hispanic or Latino/a/x
4.1%
White
78.5%
Black or African American
2.1%
American Indian or Alaska Native
0.0%
Asian
15.3%
Native Hawaiian or other Pacific Islander
0.0%
Two or more races
4.1%
Workers over the age of 55
23.4%
MassCEC Spotlight
MassCEC Workforce Deployment
MassCEC’s workforce development programs focus on expanding and diversifying the clean energy workforce, fostering heightened awareness of clean energy careers, and increasing the availability and effectiveness of training and advancement opportunities.

Regional Analysis
The Central Mass and Pioneer Valley Workforce Skills Cabinet (WSC) regions saw the highest rates of clean energy job growth, at 10% and 9%, respectively, between the 2023 and 2024 reports.24-25 The Berkshire WSC region experienced 5% growth in clean energy businesses over the same time, with clean energy businesses now representing 7% of all businesses in the region.
Clean Energy Employment and Businesses in the Workforce Skills Cabinet Regions in Massachusetts,
Report Years 2023 – 2024
Berkshire
Cape Cod
Central Mass
Greater Boston
Northeast
Pioneer Valley
Southeast
Employment
Businesses
Businesses
Employment
Businesses
Businesses
Employment
Businesses
Businesses
Employment
Businesses
Businesses
Employment
Businesses
Businesses
Employment
Businesses
Businesses
Employment
Businesses
Businesses
2023 Report
3,129
244
244
5,579
527
527
17,987
1,129
1,129
38,448
2,342
2,342
11,001
815
815
9,870
829
829
22,436
1,430
1,430
2024 Report
3,284
257
257
5,928
544
544
19,724
1,159
1,159
40,725
2,409
2,409
11,642
830
830
10,713
845
845
23,274
1,462
1,462
2023-2024
Report Change
Report Change
5.0%
5.2%
5.2%
6.3%
3.3%
3.3%
9.7%
2.7%
2.7%
5.9%
3.1%
3.1%
5.8%
1.9%
1.9%
8.5%
1.9%
1.9%
3.7%
2.3%
2.3%
Percent of Total
Clean Energy Jobs/
Businesses in 2024
Clean Energy Jobs/
Businesses in 2024
2.8%
3.4%
3.4%
5.1%
7.2%
7.2%
17.1%
15.4%
15.4%
35.3%
32.1%
32.1%
10.1%
11.1%
11.1%
9.3%
11.3%
11.3%
20.2%
19.5%
19.5%
Percent of Total
Jobs/Businesses
in Region
Jobs/Businesses
in Region
5.2%
6.8%
6.8%
4.6%
4.8%
4.8%
5.2%
6.0%
6.0%
2.2%
3.4%
3.4%
2.7%
3.3%
3.3%
3.4%
5.8%
5.8%
3.9%
4.3%
4.3%
2023 Report
Berkshire
Cape Cod
Central Mass
Greater Boston
Northeast
Pioneer Valley
Southeast
Employment
Businesses
Businesses
Employment
Businesses
Businesses
Employment
Businesses
Businesses
Employment
Businesses
Businesses
Employment
Businesses
Businesses
Employment
Businesses
Businesses
Employment
Businesses
Businesses
2,982
214
214
5,309
444
444
17,073
1,254
1,254
37,071
2,199
2,199
10,608
709
709
9,583
727
727
21,664
1,609
1,609
2024 Report
Berkshire
Cape Cod
Central Mass
Greater Boston
Northeast
Pioneer Valley
Southeast
Employment
Businesses
Businesses
Employment
Businesses
Businesses
Employment
Businesses
Businesses
Employment
Businesses
Businesses
Employment
Businesses
Businesses
Employment
Businesses
Businesses
Employment
Businesses
Businesses
3,129
229
229
5,579
456
456
17,987
1,274
1,274
38,448
2,242
2,242
11,001
718
718
9,870
748
748
22,436
1,648
1,648
2023-2024 Report Change
Berkshire
Cape Cod
Central Mass
Greater Boston
Northeast
Pioneer Valley
Southeast
Employment
Businesses
Businesses
Employment
Businesses
Businesses
Employment
Businesses
Businesses
Employment
Businesses
Businesses
Employment
Businesses
Businesses
Employment
Businesses
Businesses
Employment
Businesses
Businesses
4.9%
7.0%
7.0%
5.1%
2.7%
2.7%
5.4%
1.6%
1.6%
3.7%
2.0%
2.0%
3.7%
1.3%
1.3%
3.0%
2.9%
2.9%
3.6%
2.4%
2.4%
Percent of Total Clean Energy Jobs / Businesses in 2023
Berkshire
Cape Cod
Central Mass
Greater Boston
Northeast
Pioneer Valley
Southeast
Employment
Businesses
Businesses
Employment
Businesses
Businesses
Employment
Businesses
Businesses
Employment
Businesses
Businesses
Employment
Businesses
Businesses
Employment
Businesses
Businesses
Employment
Businesses
Businesses
2.9%
3.1%
3.1%
5.1%
6.2%
6.2%
16.6%
17.4%
17.4%
35.5%
30.6%
30.6%
10.1%
9.8%
9.8%
9.1%
10.2%
10.2%
20.7%
22.5%
22.5%
Percent of Total Jobs/Businesses in Region
Berkshire
Cape Cod
Central Mass
Greater Boston
Northeast
Pioneer Valley
Southeast
Employment
Businesses
Businesses
Employment
Businesses
Businesses
Employment
Businesses
Businesses
Employment
Businesses
Businesses
Employment
Businesses
Businesses
Employment
Businesses
Businesses
Employment
Businesses
Businesses
5.0%
4.0%
4.0%
4.5%
3.5%
3.5%
4.8%
4.4%
4.4%
2.2%
2.1%
2.1%
2.4%
1.9%
1.9%
3.2%
2.6%
2.6%
3.8%
3.4%
3.4%
State-By-State Comparison
Massachusetts continues to be a leader in clean energy jobs. The Commonwealth ranks 2nd for total number of clean energy jobs as a percentage of total employment in the state.26
Subset Of State Clean Energy Job Rankings, Report Year 2024
Total Clean Energy Jobs
Relative to State Workforce
1
Vermont
4.5%
2
Massachusetts
3.1%
3
Michigan
3.0%
4
Wyoming
2.9%
5
Utah
2.9%
6
Rhode Island
2.8%
7
Tennessee
2.8%
8
California
2.6%
9
Indiana
2.5%
10
Oregon
2.5%
Total Clean Energy
Jobs Per Capita
1
Vermont
2.2%
2
District of Columbia
1.9%
3
Massachusetts
1.6%
4
Wyoming
1.4%
5
Michigan
1.3%
6
Utah
1.3%
7
Rhode Island
1.3%
8
North Dakota
1.2%
9
Tennessee
1.2%
10
California
1.2%
Total Clean
Energy Jobs
1
California
453,650
2
Texas
254,264
3
Florida
155,732
4
New York
144,215
5
Michigan
130,582
6
Massachusetts
115,291
7
Illinois
106,464
8
Ohio
102,798
9
North Carolina
91,283
10
Virginia
86,677
1 This report defines a clean energy worker as a person who spends some portion of their time working in renewable energy, energy efficiency, clean transportation, or other carbon management technologies. Only those workers who directly support clean energy activities, such as conducting research, manufacturing products, performing installations, or repairing and maintaining clean energy systems, are included as clean energy workers. However, the impact of the industry is significantly greater than these “direct” jobs alone.
2 The definition of clean energy has been updated from previous reports to remove Woody Biomass and include Hybrid Electric and Plug-in Hybrid Electric Vehicles, along with Hydropower. Previous years’ figures have been updated to this definition unless otherwise noted.
3 2024 job numbers represented in this report are based on the 2024 USEER data collection effort and represent the net change in employment between December 2022 and December 2023.
4 The definition of clean energy has been updated from previous reports to remove Woody Biomass and include Hybrid Electric and Plug-in Electric Vehicles, along with Traditional Hydropower. Previous years’ figures have been updated to this definition unless otherwise noted.
5 Annual job numbers are based on 4th quarter averages from the Bureau of Labor Statistics.
6 Definitions for all clean energy value chains, sectors, and sub-sectors can be found in the Glossary of this report.
7 2024 job numbers represented in this report are from the 2024 USEER data collection and represent the net change in employment between December 2022 and December 2023.
7 2024 job numbers represented in this report are from the 2024 USEER data collection and represent the net change in employment between December 2022 and December 2023.
8 Definitions for all clean energy sectors and sub-sectors can be found in the Glossary section of this report.
9 2024 job numbers represented in this report are from the 2024 USEER data collection and represent the net change in employment between December 2022 and December 2023.
9 2024 job numbers represented in this report are from the 2024 USEER data collection and represent the net change in employment between December 2022 and December 2023.
10 2024 job numbers represented in this report are from the 2024 USEER data collection and represent the net change in employment between December 2022 and December 2023.
11 This year’s report removes Woody Biomass from this sector. Previous years’ numbers have been adjusted to reflect this change.
11 This year’s report removes Woody Biomass from this sector. Previous years’ numbers have been adjusted to reflect this change.
12 2024 job numbers represented in this report are from the 2024 USEER data collection and represent the net change in employment between December 2022 and December 2023.
13 This year’s report includes the addition of Hybrid Electric and Plug-in Hybrid Electric in the Clean Transportation sector. Previous years’ numbers have been adjusted to also include this clean energy definition change.
13 This year’s report includes the addition of Hybrid Electric and Plug-in Hybrid Electric in the Clean Transportation sector. Previous years’ numbers have been adjusted to also include this clean energy definition change.
14 2024 job numbers represented in this report are from the 2024 USEER data collection and represent the net change in employment between December 2022 and December 2023.
15 This year’s report includes the addition of Traditional Hydropower into the Renewable Energy sector. Previous years’ numbers have been adjusted to also include this addition in the clean energy definition.
15 This year’s report includes the addition of Traditional Hydropower into the Renewable Energy sector. Previous years’ numbers have been adjusted to also include this addition in the clean energy definition.
16 For purposes of this report, a business is an establishment location. A clean energy business or firm with multiple locations would be counted multiple times in this analysis, based on the number of unique locations.
17 Employment extrapolations are based on BLS QCEW and survey data, resulting in totals that carry precise decimal values. As a result, some totals for tables and graphs in the report will sum differently due to rounding.
17 Employment extrapolations are based on BLS QCEW and survey data, resulting in totals that carry precise decimal values. As a result, some totals for tables and graphs in the report will sum differently due to rounding.
18 Union coverage refers to workers who are represented by a union through collective bargaining but may not be members of the union directly.
19 Massachusetts clean energy employer hiring difficulty was extrapolated from national hiring difficulty by technology, applied to MassCEC-defined sector and subsector segments, and averaged with Massachusetts all energy hiring difficulty from the 2024 United States Energy and Employment Report (USEER). See the methodology for more details.
20 Data for age, race, ethnicity, gender: www.bls.gov/lau/table14full23.htm. Population percentages for American Indian or Alaska Native, Native Hawaiian or other Pacific Islander, or Two or more races were used due to lack a of BLS data.
Veterans’ employment: www.bls.gov/news.release/vet.t06a.htm & BLS QCEW 2023 Annual Employment for Massachusetts.
Veterans’ employment: www.bls.gov/news.release/vet.t06a.htm & BLS QCEW 2023 Annual Employment for Massachusetts.
21 Source: “Powering the Future: A Massachusetts Clean Energy Workforce Needs Assessment,” Massachusetts Clean Energy Center, July 2023. The definition of a clean energy job for the 2024 Industry Report differs slightly from that used in the MassCEC Workforce Needs Assessment. The 28,900 additional jobs estimate is based on this updated 2024 definition, while still adhering to the Workforce Needs Assessment methodology.
22 Source: U.S. Bureau of Labor Statistics. Occupation Employment and Wage Statistics. May 2023. Accessed August 2024. www.bls.gov/oes/current/oes_stru.htm.
23 These data represent wages for a subset of occupations in Massachusetts, which have significant representation in the clean energy industry. The data are not for clean energy jobs specifically. Source: JobsEQ® www.jobseq.com. Accessed September 2024. Occupation Wages, Average Hourly in Massachusetts, 2024Q1 & Occupation Diversity, in Massachusetts, 2024Q1, based on place of residence estimates.
24 Source: JobsEQ accessed September 2024. Data Explorer, Industry Data, 4-quarter moving average employment in Massachusetts, 2022 & 2023.
25 Business data is only available at the county level, and the Workforce Skills Cabinet (WSC) regions are determined by zip code. Some counties fall within only one WSC and can be categorized as a single WSC region. Other counties fall within multiple WSC regions, so establishment data from the county level is allocated proportionally between the multiple WSC regions based on employment data per region at the zip code level. Report change growth may be inflated due to state clean energy definition changes.
25 Business data is only available at the county level, and the Workforce Skills Cabinet (WSC) regions are determined by zip code. Some counties fall within only one WSC and can be categorized as a single WSC region. Other counties fall within multiple WSC regions, so establishment data from the county level is allocated proportionally between the multiple WSC regions based on employment data per region at the zip code level. Report change growth may be inflated due to state clean energy definition changes.
26 These employment values were calculated based on the Massachusetts clean energy definition, which may vary from the definitions of other states or organizations. For example, Massachusetts does not include HVAC or corn ethanol in its clean energy definition, while other states and organizations may. This was done for consistency so that employment values could be compared across states.