2023
MASSACHUSETTS CLEAN ENERGY INDUSTRY REPORT
2023
MASSACHUSETTS CLEAN ENERGY INDUSTRY REPORT
CONTENTS
About MassCEC
Note From The CEO
Industry Highlights
Economic Contribution
Massachusetts Is A Leader
Massachusetts Climate Goals
Clean Energy Jobs and Businesses
Gross State Product
Clean Energy Talent
Workforce Needs Assessment
Clean Energy Investments and Innovation
Regional Analysis
Methodology
Glossary
ABOUT MASSCEC
SINCE 2010 MASSCEC HAS
ABOUT MASSCEC
MassCEC is governed by a Board of Directors, which is chaired by Massachusetts Energy and Environmental Affairs Secretary Rebecca Tepper.
AREAS OF FOCUS
read more…
NOTE FROM THE CEO

Emily Reichert
The Massachusetts Clean Energy Center is pleased to present our 2023 Clean Energy Industry Report. This report provides an overview of the clean energy industry in Massachusetts, demonstrates the tangible results of focused leadership in both the public and private sectors, and shares stories of MassCEC’s successful contributions to growing the industry.
This past year, the clean energy field experienced a dynamic period of powerful activity. Since taking office in January, the Healey-Driscoll Administration has sent a clear signal that Massachusetts is ready to lead on climate. Supporting expansion for equity-led workforce growth, pioneering creative climate financing solutions, bolstering budgetary support for energy and environmental activities, and striking a bold stance on offshore wind, Governor Healey and other leaders in state government are empowering Massachusetts to reach its climate targets.
It is clear there is a pressing need for a robust and well-trained clean energy workforce in Massachusetts. Presently, the state boasts 108,450 direct clean energy jobs, which further supports an additional 104,325 direct or induced jobs. In July, MassCEC unveiled an expansive Workforce Needs Assessment detailing the roadmap for clean energy workforce growth. To meet climate milestones, we must add 38,000 more workers to the industry by 2030. Building upon our robust workforce development programming, we can meet these challenges and bring valuable and rewarding careers to Massachusetts residents.
MASSACHUSETTS CLEAN ENERGY INDUSTRY HIGHLIGHTS
2023
MASSACHUSETTS CLEAN ENERGY INDUSTRY HIGHLIGHTS1


Since 2010, the Massachusetts clean energy industry has experienced:
Sub-sectors that experienced the greatest rate of job growth between 2022 and 2023 reports 2


Building Materials

ECONOMIC CONTRIBUTION ANALYSIS
ECONOMIC CONTRIBUTION ANALYSIS
DECEMBER 2022
Based on this analysis, the
MASSACHUSETTS CLEAN ENERGY INDUSTRY
is responsible for a total economic contribution of:


MASSACHUSETTS IS A LEADER
MASSACHUSETTS IS A LEADER
In the Top Ranking
MASSACHUSETTS IS A LEADER
MASSCEC SPOTLIGHT
MassCEC’s Offshore Wind Leadership
MassCEC’s work has helped to address numerous challenges to growing the offshore wind industry, including:


MassCEC’s Offshore Wind Ports Challenge
MassCEC leveraged significant private and other public investments in specific maritime port rehabilitation and redevelopment activities to advance the offshore wind sector and capture high-value supply chain and workforce opportunities for the Commonwealth.
Broader Impacts
Initial Results


MASSACHUSETTS’ CLIMATE GOALS
Massachusetts’ Climate Goals
The Commonwealth has made progress in decarbonizing the electric grid, buildings, and vehicles, but more needs to be done to ensure the state meets its ambitious and critical goals.


CLEAN ENERGY JOBS AND BUSINESSES
TOTAL CLEAN ENERGY JOBS5
This report defines a clean energy worker as a person who spends some portion of their time working in renewable energy, energy efficiency, alternative transportation, or other carbon management technologies. In Massachusetts, 108,450 workers spend some portion of their time working in clean energy. Of those workers, 70% spend the “majority” or “all of their time” working in clean energy, compared to an average of 63% nationally.
REPORT YEARS 2010-20237
CLEAN ENERGY JOBS BY VALUE CHAIN8
JOBS BY VALUE CHAIN9
CLEAN ENERGY JOBS BY SECTOR8
The Renewable Energy sector grew by 3% and the Energy Efficiency, Demand Management, and Clean Heating and Cooling sector, which continues to have the largest number of absolute jobs, grew by 3%.
JOBS BY SECTOR9
JOBS BY SECTOR9
ENERGY EFFICIENCY, DEMAND MANAGEMENT, AND CLEAN HEATING AND COOLING JOBS10
CLEAN ENERGY JOBS AND BUSINESSES
MASSCEC SPOTLIGHT
DECARBONIZING MULTI-FAMILY BUILDINGS
MassCEC’s Passive House Design Challenge
Program Results


Broader Impacts


CLEAN ENERGY JOBS AND BUSINESSES
ALTERNATIVE TRANSPORTATION JOBS11
CLEAN ENERGY JOBS AND BUSINESSES
MASSCEC SPOTLIGHT
ACCELERATING CLEAN TRANSPORTATION
MassCEC developed the Accelerating Clean Transportation for All (ACT4All) Program to pilot equity‑focused transportation programs and increase access for disadvantaged communities across Massachusetts. One program was focused on increasing e-bike use in pilots across the state.
MassCEC’s ACT4ALL E-Bike Projects
Cape Light Compact
MASSBIKE
Metro Mobility
Pioneer Valley Planning Commission


CLEAN ENERGY JOBS AND BUSINESSES
RENEWABLE ENERGY JOBS12
Massachusetts’ solar industry grew by 3% (506 jobs), which is just slightly lower than the nationwide growth in solar jobs of 4%.
CLEAN ENERGY BUSINESSES
Small businesses (1 to 10 employees) account for 58% of all clean energy businesses, which is similar to the 2022 report. Mid-size businesses (11 to 49 employees) represent 27% of clean energy businesses.
GROSS STATE PRODUCT
CLEAN ENERGY GROSS STATE PRODUCT14
CLEAN ENERGY GROSS STATE PRODUCT BY VALUE CHAIN14
The Manufacturing sector continues to account for the largest contribution to clean energy GSP, at 24%, or $3.6 billion.
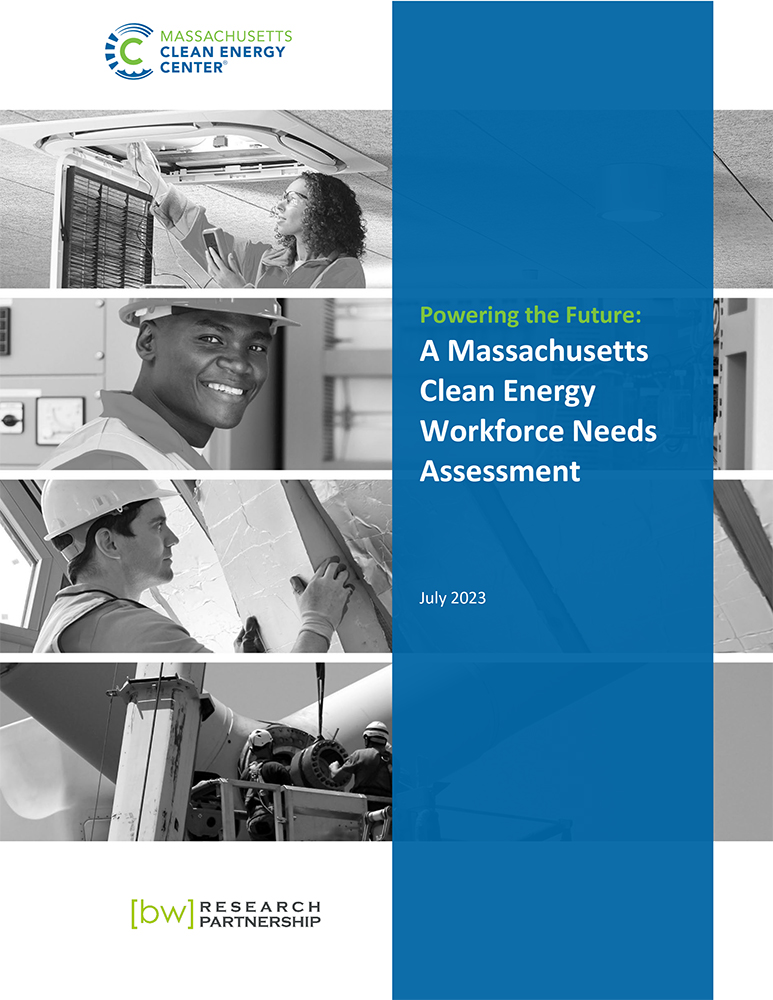
WORKFORCE NEEDS ASSESSMENT
MASSCEC SPOTLIGHT
MASSACHUSETTS CLEAN ENERGY WORKFORCE NEEDS ASSESSMENT
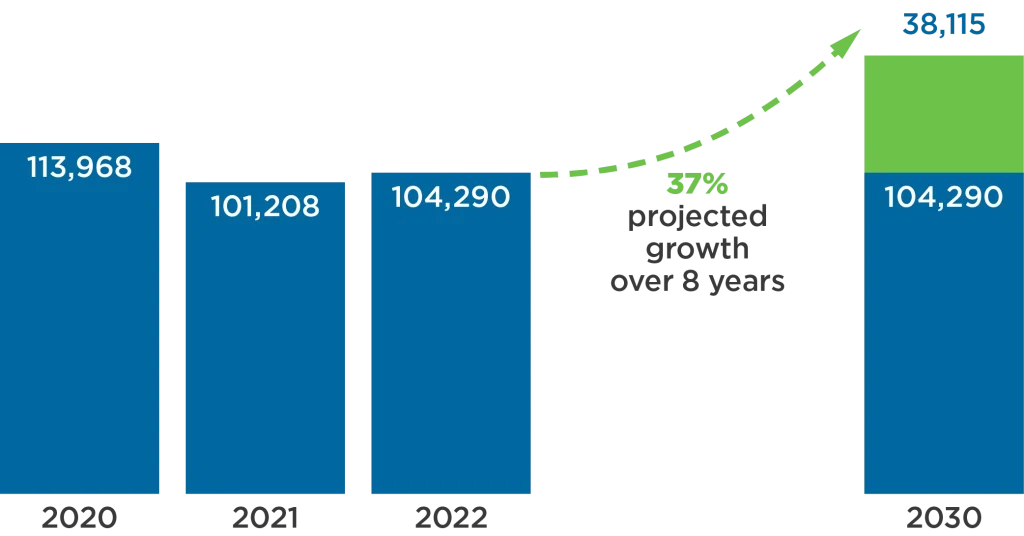
Major findings of the report:
Top Five Report Highlights and Recommendations
There are many approaches that can reduce barriers to entry into the clean energy industry for prospective workers. Among them, expanding access to accurate, engaging, and comprehensive information about clean energy career pathways is essential to driving career awareness, especially for underrepresented populations in the industry. Future investments in training capacity should focus on expanding access to training opportunities and enhancing outreach and support services. Efforts to engage clean energy businesses to deploy inclusive hiring practices and a welcoming and supportive work environment can support increasing worker retention and diversity in the industry.
Additionally, some persistent barriers, such as lack of reliable transportation, will require a whole government approach to effectively address.
BARRIERS TO ENTRY INTO CLEAN ENERGY BY RACE AND ETHNICITY17
CLEAN ENERGY TALENT
CLEAN ENERGY TALENT IS NEEDED
According to surveyed employers, approximately 71% of clean energy workers who were hired between December 2021 and December 2022 filled positions that required previous work experience. About 59% of these job hires filled newly created positions. The education credential requirements for the filled positions ranged, but almost half (49%) required a bachelor’s degree or higher. Alternatively, according to a recent MassCEC report, between now and 2030, clean energy employers will require a range of new workers across 140+ occupations, many of which will require less than a 4-year degree for entry.18
REASONS FOR HIRING CHALLENGES
CLEAN ENERGY TALENT
MASSCEC SPOTLIGHT
BUILDING THE CLEAN ENERGY WORKFORCE PIPELINE
MassCEC’s Clean Energy Internship Program
Program Results


Broader Impacts


Collaborating to Expand Clean Energy Career Awareness
Broader Impacts
CLEAN ENERGY TALENT
CLEAN ENERGY WORKER DEMOGRAPHICS20
The state is committed to supporting individuals in environmental justice neighborhoods and disadvantaged populations to get the education and training needed to access high-paying occupations in clean energy and enabling minority and women-owned business enterprises to access the resources needed to pivot and grow as employers in the clean energy industry.
CLEAN ENERGY WAGES
DIVERSITY CONSIDERATIONS
Employers utilize a variety of methods to increase diversity among workers, with targeting schools or conducting outreach being the most common strategy.
EMPLOYER SUPPORT PROGRAMS
Increasing registered apprenticeships is important, as it is a proven model for improving access to careers and is supported financially at the state and federal level.23
SPONSORSHIP PROGRAM REPORT YEAR 2023
CLEAN ENERGY TALENT
MASSCEC SPOTLIGHT
INCREASING EQUITY IN THE CLEAN ENERGY INDUSTRY
MassCEC Equity Workforce Planning, Capacity, and Implementation Grant Program
Initial Program Highlights

Broader Impacts


CLEAN ENERGY INVESTMENTS AND INNOVATION
CLEAN ENERGY INVESTMENTS
Investments in clean energy companies can fall into three key segments24:
Stage II: Demonstration & Acceleration – Companies at the product testing, system evaluation, and market research stage.
Stage III: Commercialization & Growth – Companies that are expanding manufacturing capacity and identifying early-stage customers.
TOTAL MASSACHUSETTS CLEAN ENERGY DEALS24,25
TOTAL MASSACHUSETTS CLEAN ENERGY INVESTMENTS (millions)25, 26
CLEAN ENERGY INVESTMENTS AND INNOVATION
MASSCEC SPOTLIGHT
MASSCEC INVESTMENTS PORTFOLIO
MassCEC’s clean energy company investments have yielded


MASSCEC SUPPORT FOR INNOVATION
MassCEC provides funding and mentorship to Climatetech startups, researchers, incubators, and accelerators.
Since 2010 MassCEC’s Technology Development and Innovation Program has facilitated:


REGIONAL ANALYSIS
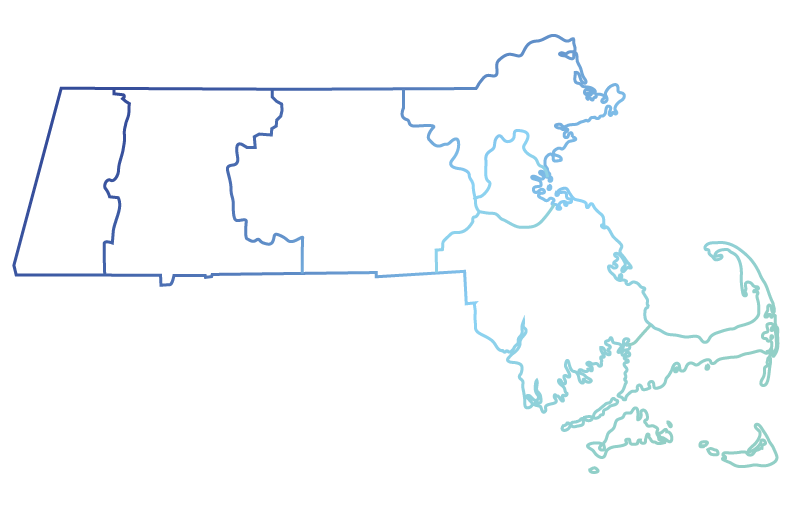
REGIONAL ANALYSIS
Clean Energy Jobs And Businesses In Massachusetts Workforce Skills Cabinet Regions
Businesses
Businesses
Businesses
Businesses
Businesses
Businesses
Businesses
214
444
1,254
2,199
709
727
1,609
229
456
1,274
2,242
718
748
1,648
Report Change
7.0%
2.7%
1.6%
2.0%
1.3%
2.9%
2.4%
Clean Energy Jobs/
Businesses in 2023
3.1%
6.2%
17.4%
30.6%
9.8%
10.2%
22.5%
Jobs/Businesses
in Region
4.0%
3.5%
4.4%
2.1%
1.9%
2.6%
3.4%
Businesses
Businesses
Businesses
Businesses
Businesses
Businesses
Businesses
214
444
1,254
2,199
709
727
1,609
Businesses
Businesses
Businesses
Businesses
Businesses
Businesses
Businesses
229
456
1,274
2,242
718
748
1,648
Businesses
Businesses
Businesses
Businesses
Businesses
Businesses
Businesses
Report Change
7.0%
2.7%
1.6%
2.0%
1.3%
2.9%
2.4%
Businesses
Businesses
Businesses
Businesses
Businesses
Businesses
Businesses
Clean Energy Jobs/
Businesses in 2023
3.1%
6.2%
17.4%
30.6%
9.8%
10.2%
22.5%
Businesses
Businesses
Businesses
Businesses
Businesses
Businesses
Businesses
Jobs/Businesses
in Region
4.0%
3.5%
4.4%
2.1%
1.9%
2.6%
3.4%
STATE-BY-STATE COMPARISON
STATE CLEAN ENERGY JOB RANKINGS, REPORT YEAR 202328
TOTAL STATE CLEAN ENERGY JOBS
TOTAL CLEAN ENERGY JOBS PER CAPITA
TOTAL CLEAN ENERGY JOBS AS A PERCENTAGE OF TOTAL STATE EMPLOYMENT
STATE CLEAN ENERGY JOB RANKINGS, REPORT YEAR 2023
METHODOLOGY
METHODOLOGY
The 2023 USEER survey in Massachusetts was administered by telephone, with approximately 29,400 outbound calls in Massachusetts, as well as by web, with more than 12,600 emails sent to potential participants across the state.
In total, 1,147 business establishments in Massachusetts participated in the survey effort, with 402 providing full responses to the survey. These responses were used to develop incidence rates among industries as well as to apportion employment across various industry categories in ways currently not provided by state and federal labor market information agencies. The margin of error is +/- 4.87 percent at a 95 percent confidence level. See the full Expanded Methodology for more details on the 2023 Massachusetts Clean Energy Industry Report.